Disclaimer: The Pima County Regional Flood Control District makes no warranty, expressed nor implied, regarding the accuracy of the data provided.
ALERT System data come from remote automated sensors.
These data are being supplied for general information only.
The user agrees to comply with the Limitation of Use and Assumption of Risk terms as stated in full disclaimer ◳.
Choose dates first for retrieving cumulative rainfall depth and then click the Update button to display the results
Historical Data
Click a category below and then select a sensor on the map
Depth or Intensity
Display Sensor List?
Show IDs Only?
Depth
Yes
Yes
Intensity
No
No
-->
Links
Test
Test
Rainfall Depth
No Measurable Rain
< 0.50 inch
0.5 - 1.00 inch
> 1.00 inch
Missing Data
Rainfall Intensity
No Measurable Rain
< 0.50 inch/hour
0.5 - 1.00 inch/hour
> 1.00 inch/hour
Missing Data
Other Jurisdiction Gages:
No Measureable Rain
inch
Missing Data
Click on map values for additional data.
Streamflow
PCRFCD Streamflow in cfs
Missing Data
Other Jurisdiction Gages:
Streamflow in cfs
Missing Data
cfs = (cubic feet per second) is the rate of water moving past a stream gage at the time of measurement.
Click on map values for additional info.
Major Streams
Washes with Inundation Maps
Washes without Inundation Maps
Click on lines to see wash names
Weather
Air Temperature
Relative Humidity
Dew Point
Wind Direction
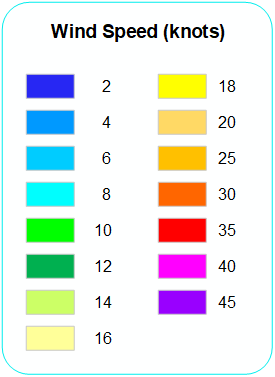
Wind Speed
Barometric Pressure
Missing Data
Other Jurisdiction Gages
Typical for all sensor types
Hover the cusor over a data value to determine the sensor id.
Click on map values for additional data.
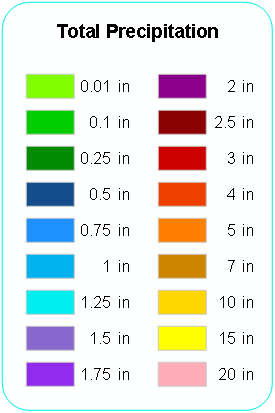
Prior Day Precip Estimate (QPE)
0.01"
2"
0.1"
2.5"
0.25"
3"
0.5"
4"
0.75"
5"
1"
7"
1.25"
10"
1.5"
15"
1.75"
20"
Current Year Arizona Fires
Zoom in to to see detailed fire boundary. Click on icon to see detailed information.
Fire Perimeter
Zoom in to to see detailed fire boundary. Click on icon to see detailed information.
National Weather Service Warnings
NWS Warning
Click on warning box boundary for more information.
MCDAQ Current Data
This layer displays the current Quantitative Precipitation Forecast
from the Pima County Regional Flood Control District ALERT System.
All QPF rainfall values are FORECAST ESTIMATES in the event that storms develop.
Last 15 minutes
Last 30 minutes
Last 45 minutes
Last hour
Current Incidents
Classify by Acres
1,000,000 Acres or more
500,000 - 999,999
100,000 - 499,999
50,000 - 99,999
10,000 - 49,999
5,000 - 9,999
1,000 - 4,999
300 - 999
100 - 299
10 - 99
0.26 - 9
Less than 0.25 acres
This site provides current precipitation, stream, and weather information for Pima County. These data are updated every 5 minutes.
Use the Datasets Menu to change rainfall period or select streamflow or weather data. Use the Layers menu to turn on/off County Boundaries, Watercourses, Watersheds and National Weather Service (NWS) Warnings imagery. Use the Info Menu (Links Section) to open the Daily Storm Summary table. Daily Storm Summary provides the summary of 24 hours precipitation, daily maximum stage and discharges obtained from Pima County’s alert sensors for the selected dates. Use the Info Menu (Links section) to obtain tabular precipitation (by area) or streamflow (by watercourse) data.
Radar images are base reflectivity images from data compiled as part of NOAA’s Multi-Radar/Multi-Sensor System (MRMS) (https://www.nssl.noaa.gov/news/factsheets/MRMS_2015.March.16.pdf). The MRMS system was developed by the National Severe Storm Laboratory (NSSL) to assist in producing severe weather forecasts and warnings, hydrologic-, aviation-, and numerical-weather-predictions. Quantitative Precipitation Estimates (QPE) (labeled as “Prior Day Precipitation Estimate” in the Map Layer Tab) are based on MRMS QPE data with local gauge bias correction..
Forecast images are based on the Weather Researach Forecasting (WRF) numerical weather prediction model operated by the Department of Hydrology and Atmospheric Science at the University of Arizona (Click Here More Information)
For National Weather Service Warnings, click on the border of a warning polygon to display the text for that warning. Text warnings from the National Weather Service are available at: (https://www.nws.noaa.gov/view/national.php?prod=ALL). Warnings shown on this page are distilled from the base set to include flash flood warnings, flood warnings, tornado warnings, severe weather statements, and severe thunderstorm warnings.
Data displayed on this map are provisional data that have not been checked or verified for accuracy. Some data on this map come from sources other than Pima County Regional Flood Control District (PCRFCD). PCRFCD has no control over the accuracy and type of data transmitted. This map was created solely for the convenience of the County and related public agencies. Pima County does not warrant the accuracy of this map, and no decision involving a risk of economic loss or physical injury should be made from the data available on this site.
This layer displays the current Quantitative Precipitation Forecast
from the Pima County Regional Flood Control District ALERT System.
All QPF rainfall values are FORECAST ESTIMATES in the event that storms develop.
They are not to be confused with observational rainfal values.
 Last 15 minutes
 Last 30 minutes
 Last 45 minutes
 Last hour